Blogs 3 key things to keep in mind when interpreting cohort analysis
Cohort analyses are essential if you operate a SaaS business and want to know how you’re doing in customer retention. But, many still have difficulties with cohort charts, whether with the data collection or the result interpretation. Let us show three crucial things you must know when reading cohort analysis.
(If you haven’t known about Cohort Analysis yet, visit our blog for more details)
1. The initial cohort size is the number of new users in a specific month
The definition of new customers here is those who had their first action within your product during a specific time frame. They will be counted only once throughout the analysis period.
For example, if user A made their first purchase on an eCommerce platform in March 2022 and then returned to purchase in the next month, they are included in the cohort size of March.
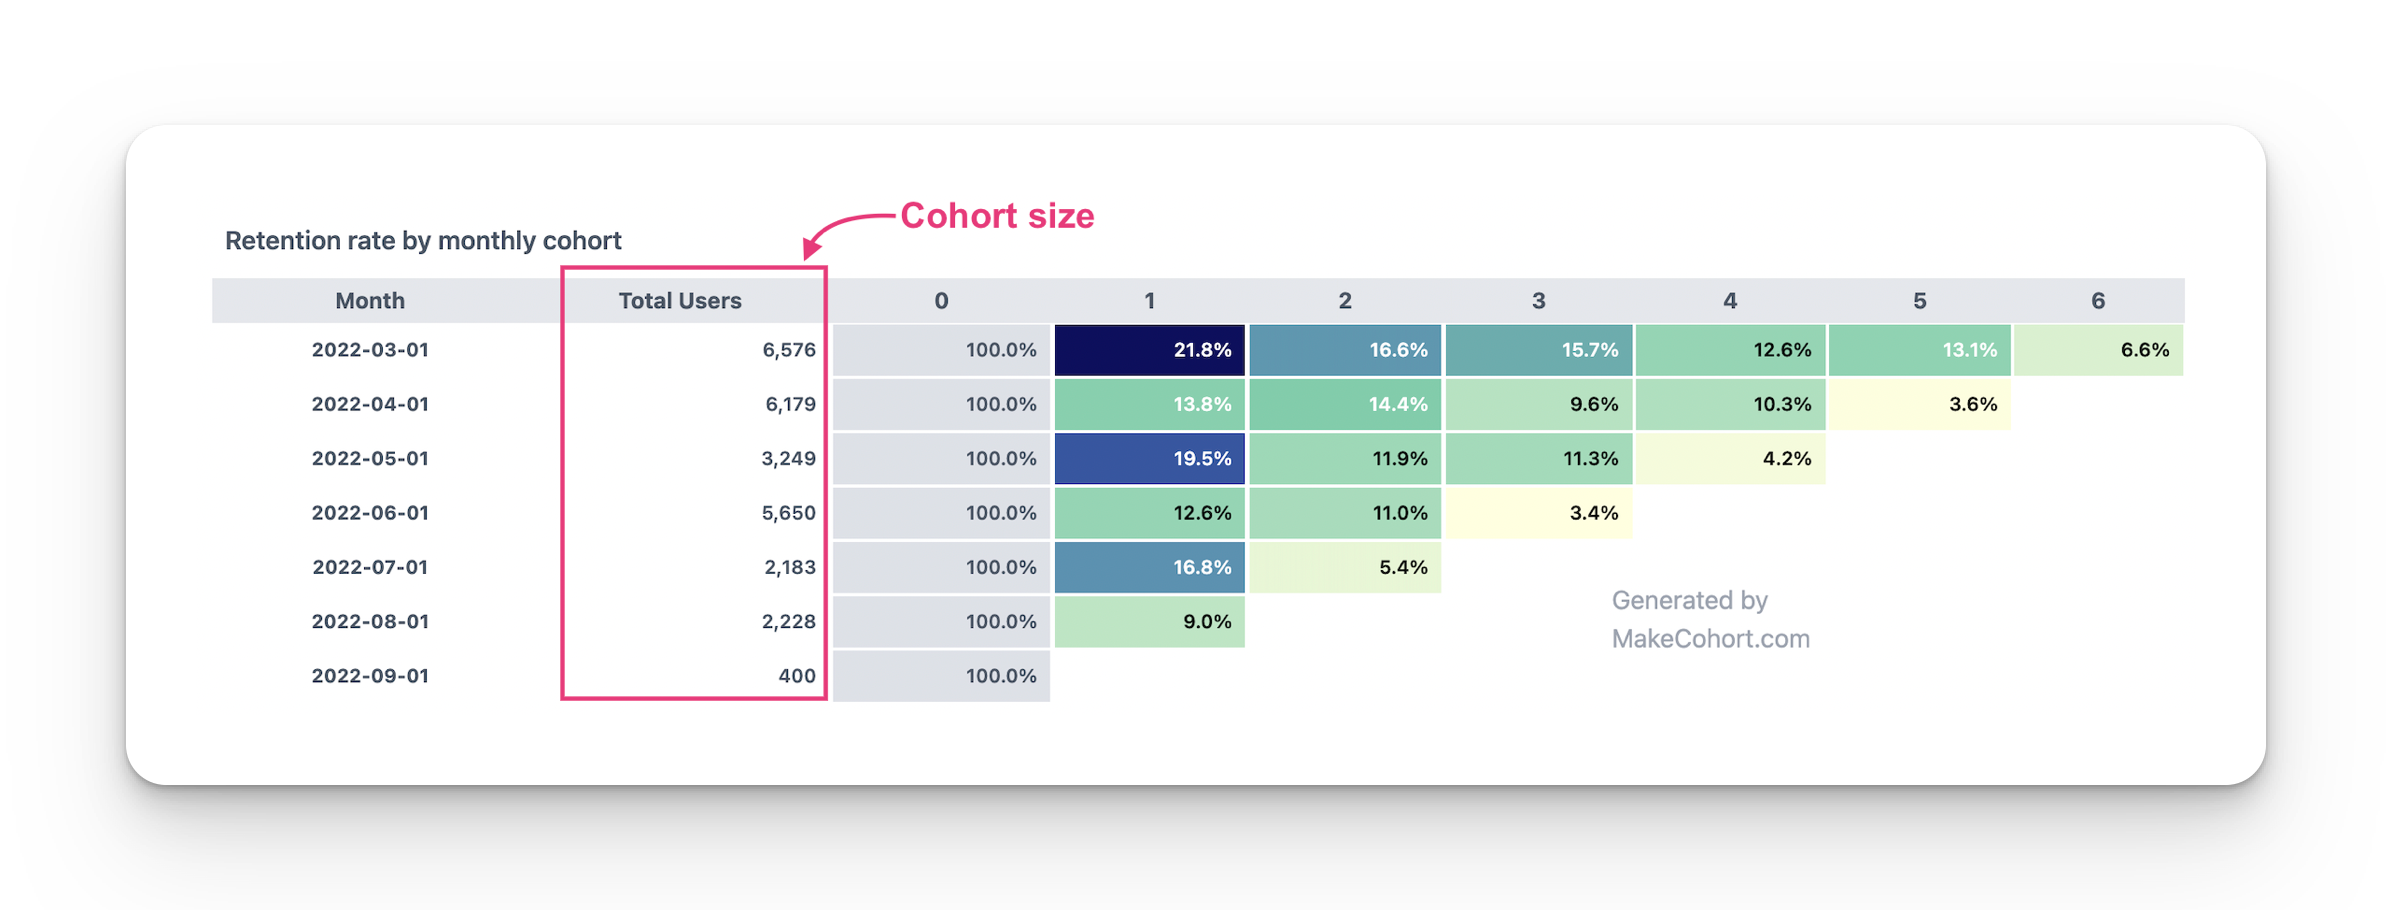
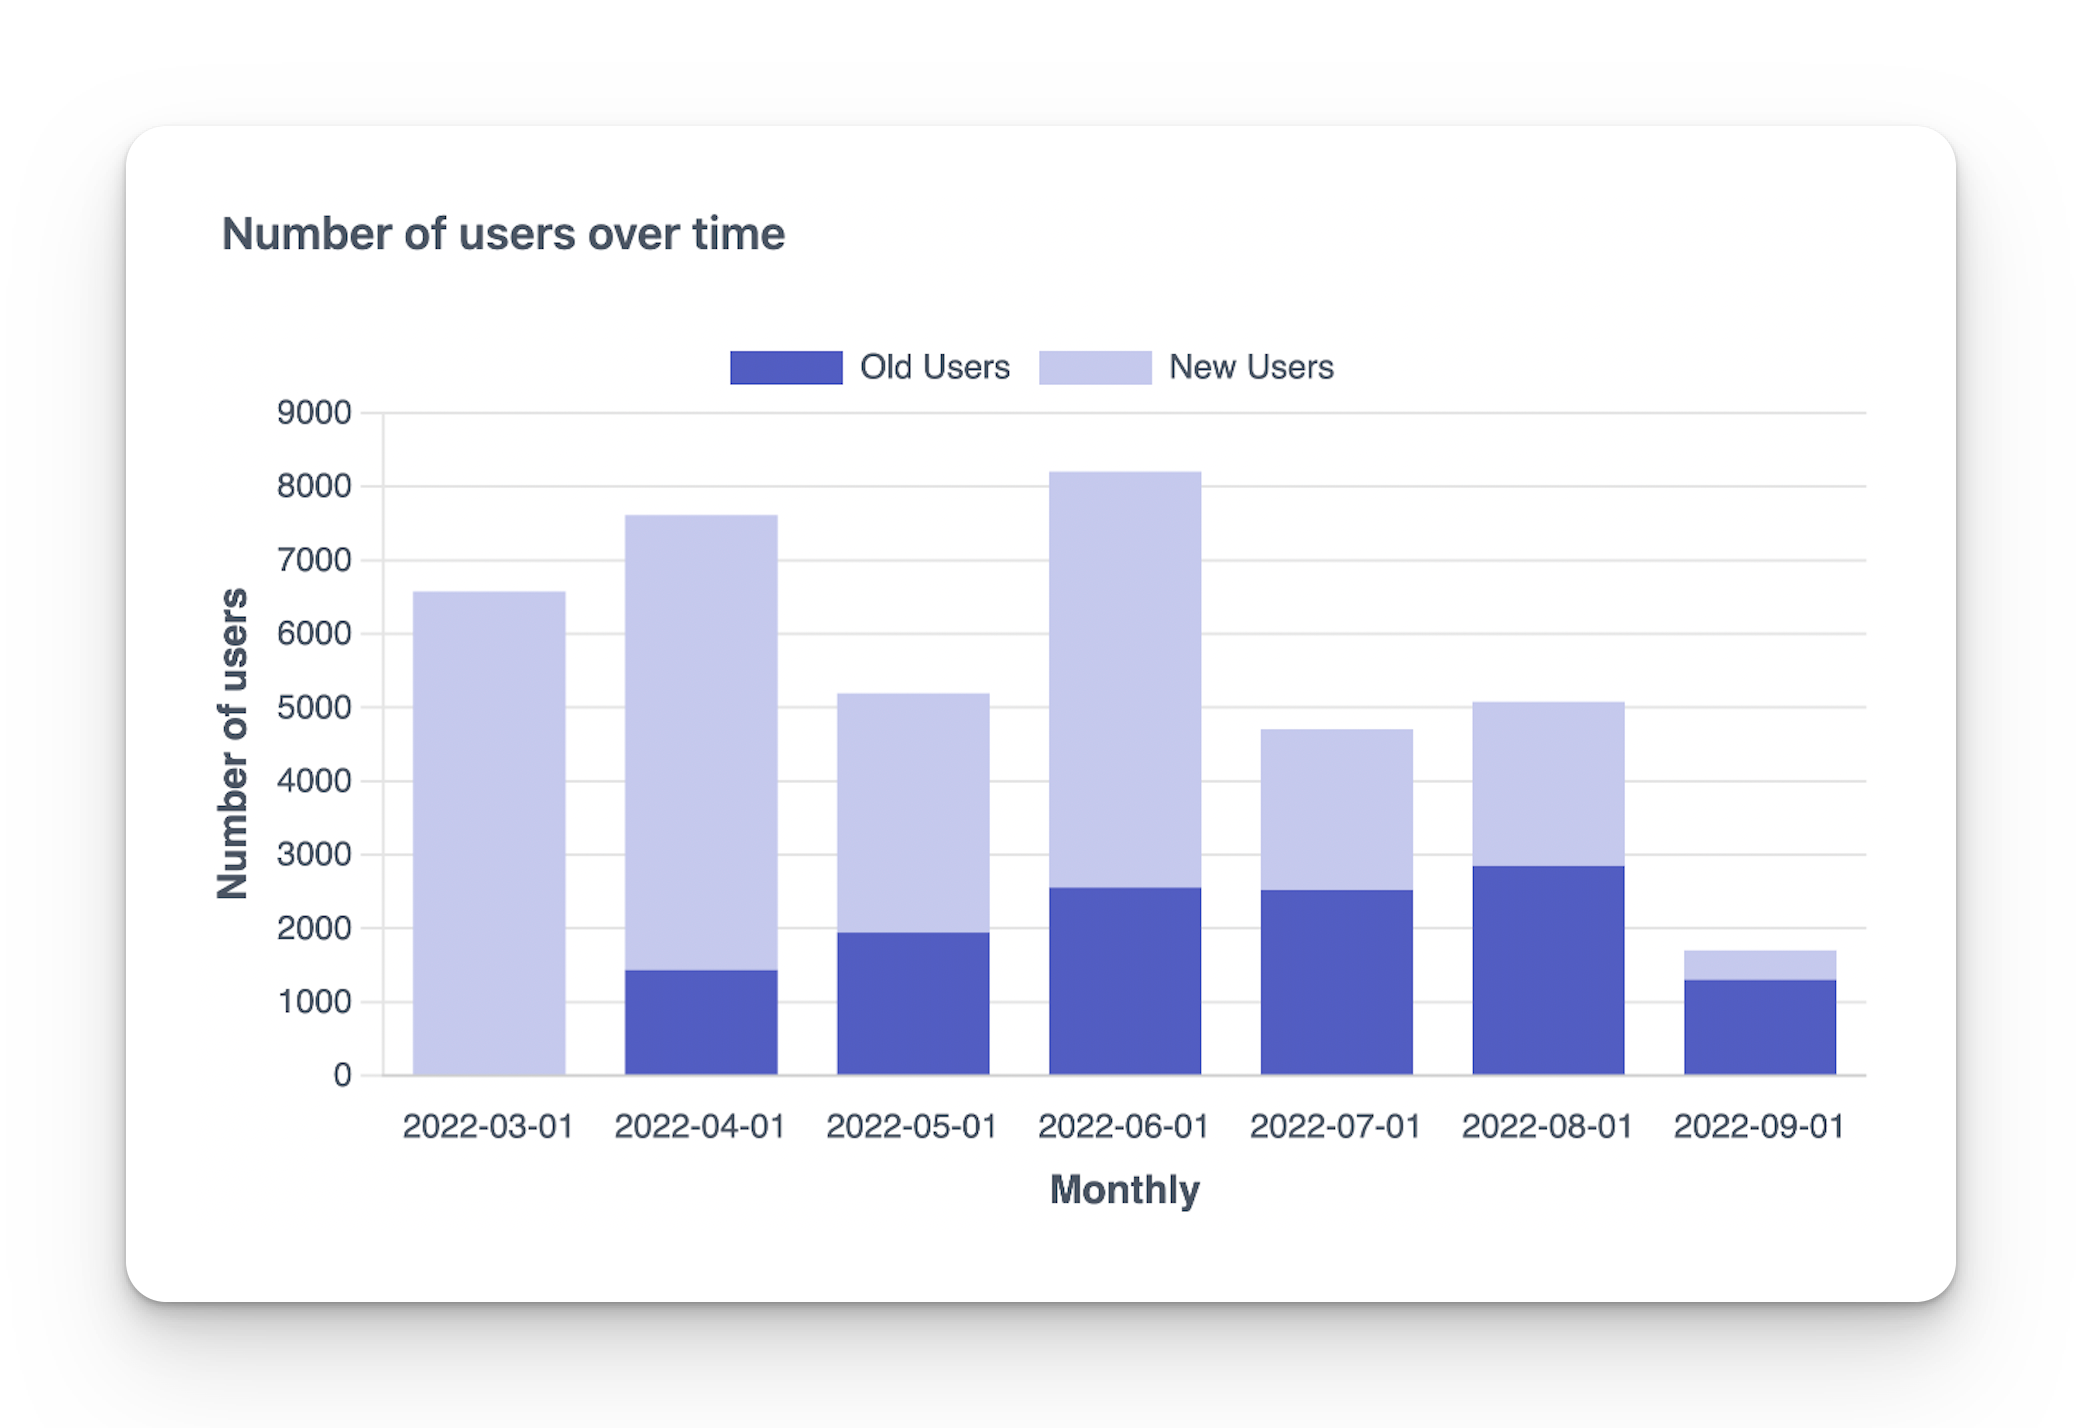
Some mistake is that the cohort size is the total of both new and old customers, but that’s not the case. Fortunately, for your interest, MakeCohort.com provides a free online tool to create a chart showing the trend of total users over time.
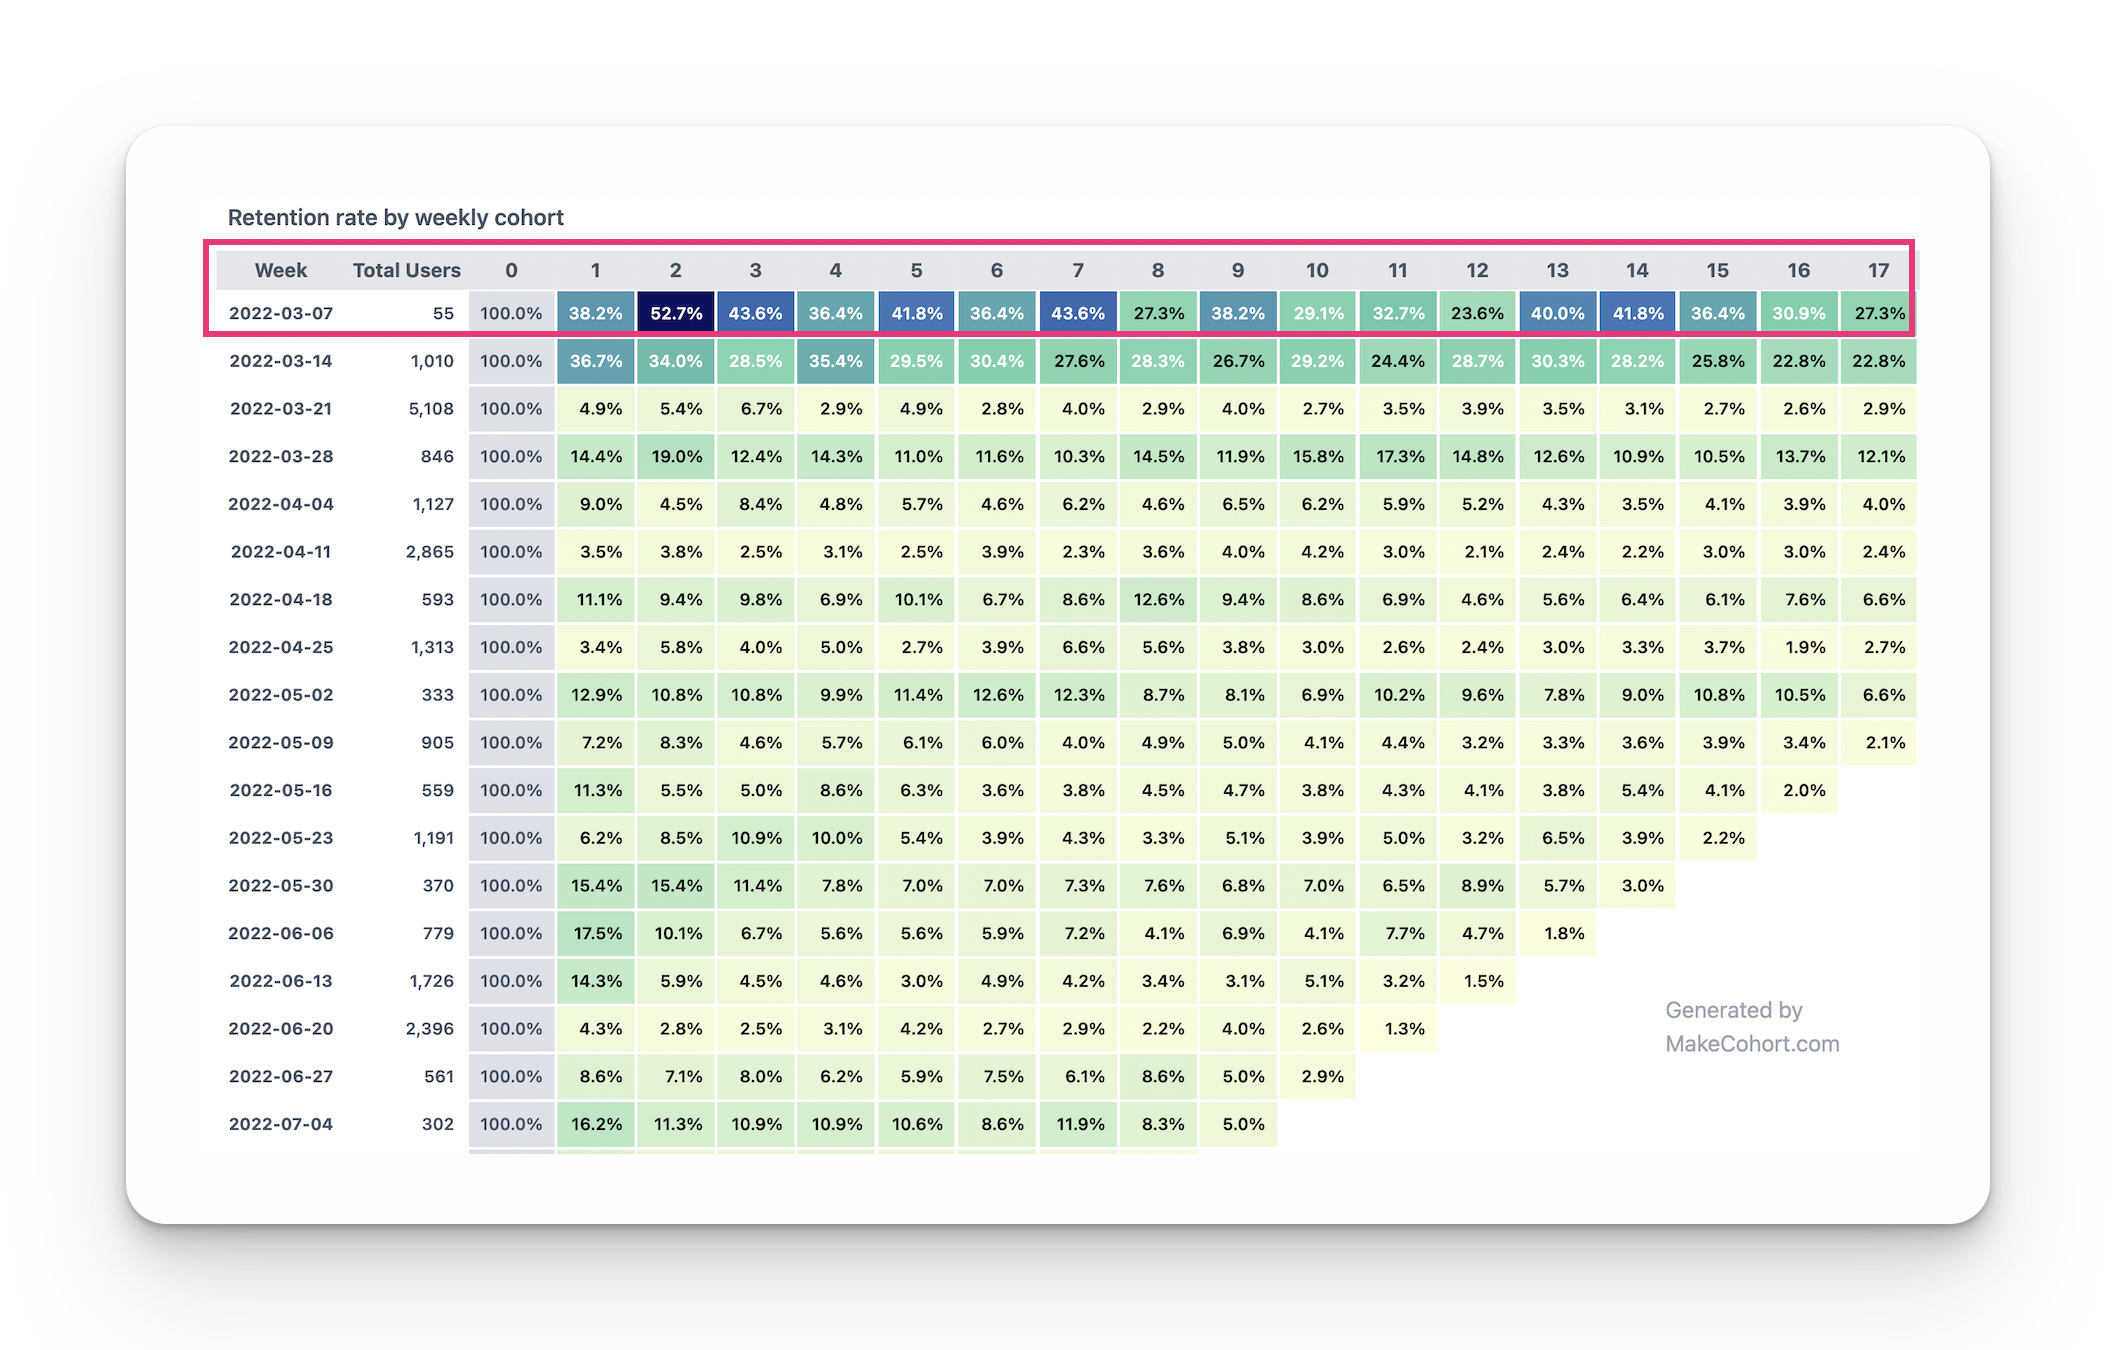
2. The cohort size matters
Having enough data will increase the accuracy of your analysis result. Because if your set of customers is too small, it tends to make noises in the result.
Taking the chart below as an example, we can notice that the cohort's retention rate in the week starting at 2022-03-07 is significantly higher than others.
However, its cohort size is 55, much smaller than other groups. If there were no special events or product changes during this period, the tiny number of users might cause this anomaly. The solution, in this case, is to exclude it from your analysis.
3. Data completeness for each time frame is a must
If you have determined a time frame to analyse (day, week, month, etc.), you should get full data from the beginning to the end of all periods.
Regarding the absolute numbers of users or revenue, the period lacking data records will possibly be lower than the others with the whole-period data collection. And that way will lead you to the wrong assessment for the period's performance.
Thanks for reading!